Generate a lineage plot based on the pseudotime.
Usage
LineagePlot(
  srt,
  lineages,
  reduction = NULL,
  dims = c(1, 2),
  cells = NULL,
  trim = c(0.01, 0.99),
  span = 0.75,
  palette = "Dark2",
  palcolor = NULL,
  lineages_arrow = arrow(length = unit(0.1, "inches")),
  linewidth = 1,
  line_bg = "white",
  line_bg_stroke = 0.5,
  whiskers = FALSE,
  whiskers_linewidth = 0.5,
  whiskers_alpha = 0.5,
  aspect.ratio = 1,
  title = NULL,
  subtitle = NULL,
  xlab = NULL,
  ylab = NULL,
  legend.position = "right",
  legend.direction = "vertical",
  theme_use = "theme_scp",
  theme_args = list(),
  return_layer = FALSE,
  seed = 11
)
Arguments
- srt
An object of class Seurat.
- lineages
A character vector that specifies the lineages to be included. Typically, use the pseudotime of cells.
- reduction
An optional string specifying the dimensionality reduction method to use.
- dims
A numeric vector of length 2 specifying the dimensions to plot.
- cells
An optional character vector specifying the cells to include in the plot.
- trim
A numeric vector of length 2 specifying the quantile range of lineages to include in the plot.
- span
A numeric value specifying the span of the loess smoother.
- palette
A character string specifying the color palette to use for the lineages.
- palcolor
An optional string specifying the color for the palette.
- lineages_arrow
An arrow object specifying the arrow for lineages.
- linewidth
A numeric value specifying the linewidth for the lineages.
- line_bg
A character string specifying the color for the background lines.
- line_bg_stroke
A numeric value specifying the stroke width for the background lines.
- whiskers
A logical value indicating whether to include whiskers in the plot.
- whiskers_linewidth
A numeric value specifying the linewidth for the whiskers.
- whiskers_alpha
A numeric value specifying the transparency for the whiskers.
- aspect.ratio
A numeric value specifying the aspect ratio of the plot.
- title
An optional character string specifying the plot title.
- subtitle
An optional character string specifying the plot subtitle.
- xlab
An optional character string specifying the x-axis label.
- ylab
An optional character string specifying the y-axis label.
- legend.position
A character string specifying the position of the legend.
- legend.direction
A character string specifying the direction of the legend.
- theme_use
A character string specifying the theme to use for the plot.
- theme_args
A list of additional arguments to pass to the theme function.
- return_layer
A logical value indicating whether to return the plot as a layer.
- seed
An optional integer specifying the random seed for reproducibility.
Examples
data("pancreas_sub")
pancreas_sub <- RunSlingshot(pancreas_sub, group.by = "SubCellType", reduction = "UMAP", show_plot = FALSE)
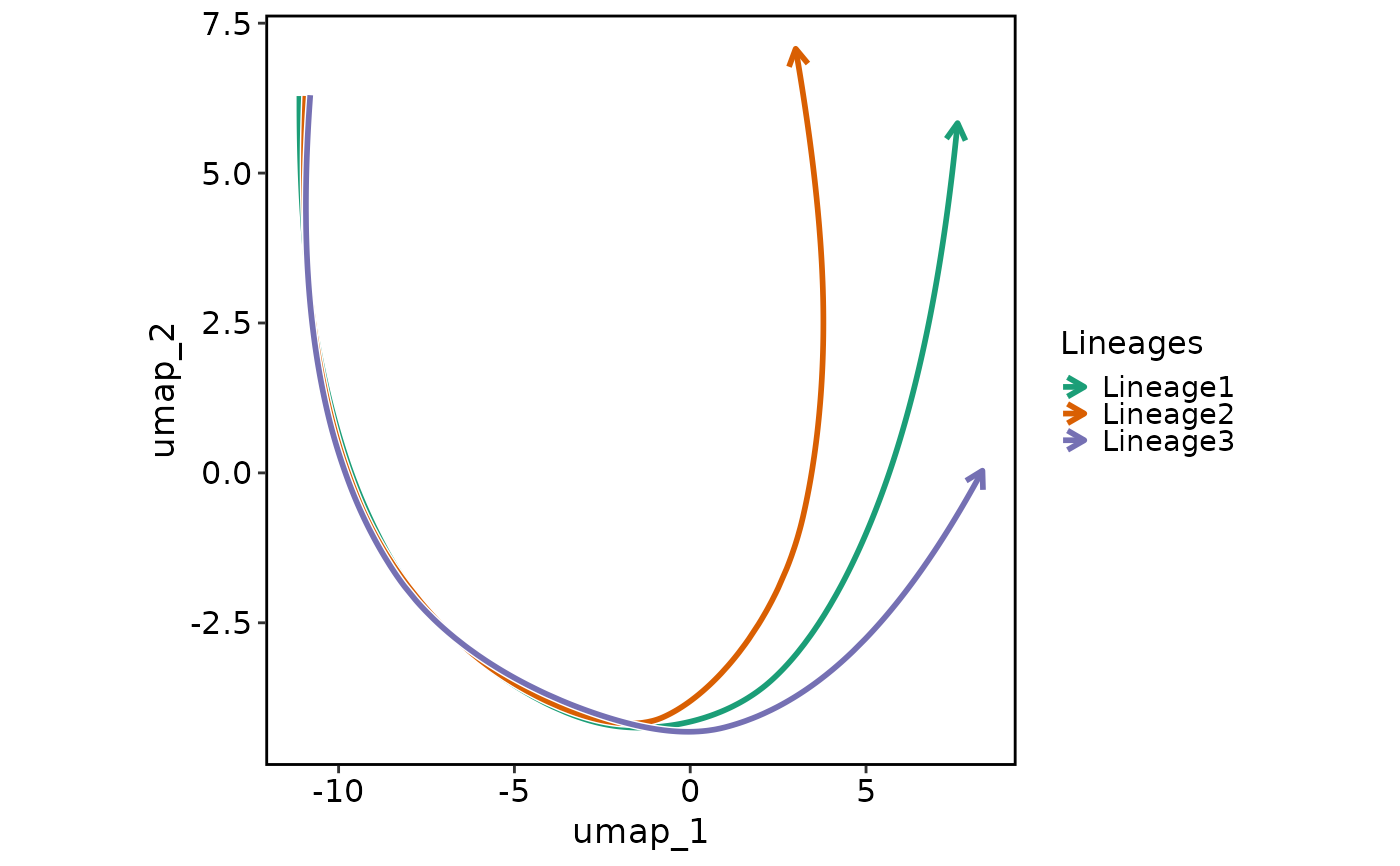
LineagePlot(pancreas_sub, lineages = paste0("Lineage", 1:3))
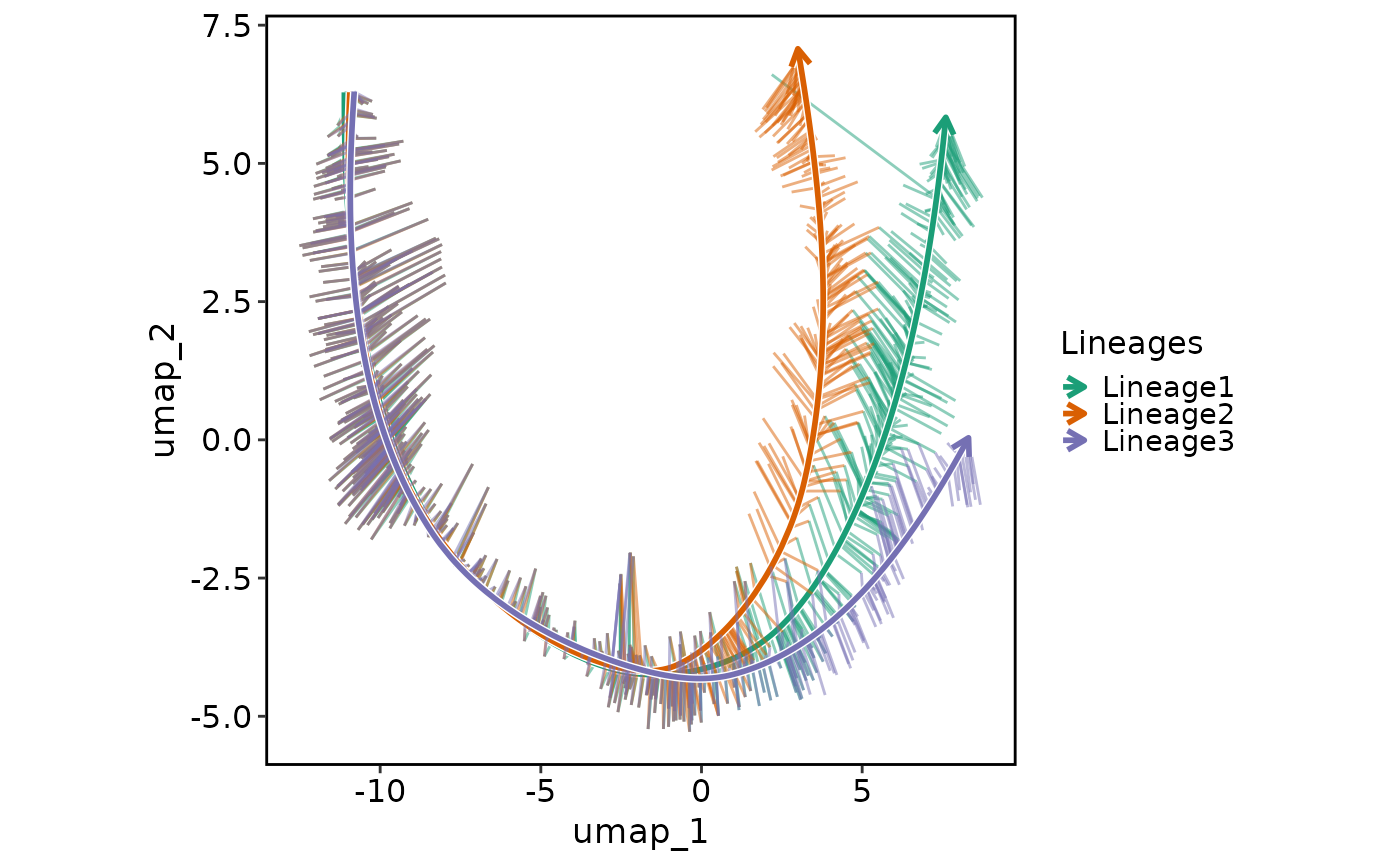
 LineagePlot(pancreas_sub, lineages = paste0("Lineage", 1:3), whiskers = TRUE)